Alphaxis Signal · Issue 001
ALPHAXIS PARTNERS · RESEARCH

The Energy Shock That Rewrites the Rules

Published 29 May 2026  ·  Data as of 18 May 2026  ·  Issue 001  ·  Approved for publication
Alphaxis Partners · Monthly Research
Issue 001 · May 2026

The Energy Shock That Rewrites the Rules

Three months into the Hormuz closure, the post-pandemic disinflationary consensus is broken. Oil above $103, US CPI at 3.8%, yields at multi-year highs, and a Fed that markets now price as more likely to hike than cut by year-end.
Issue in three lines

The Hormuz closure has broken the disinflationary consensus. Oil sits above $103, US CPI at 3.8%, and markets now price the Fed as more likely to hike than cut by December.

Private credit's $60 trillion book faces its first stress test at 4.63% 10-year yields. BDC marks and HY spreads are the leading indicators.

AI capex keeps equities aloft, but the Mag-7 sits at 30–35% of SPX weighting with TSMC as the irreplaceable bottleneck. Summer earnings will tell us if monetisation is keeping pace.

Alphaxis Signal  ·  Issue 001  ·  May 2026 Published by Alphaxis Partners Ltd
Section 1 of 5

Macro Frame: May 2026

The Global Picture: Three Months That Changed the Rate Cycle

The 2026 consensus has broken. Inflation was meant to be retreating, the Fed was meant to cut two or three times, and the growth-inflation trade-off was meant to favour growth. None of that holds now. What replaced it is genuine regime ambiguity, with the direction of monetary policy uncertain for the first time since the 2022–23 hiking cycle.

The cause is physical. The US-Iran conflict that began in late February has effectively closed the Strait of Hormuz, the chokepoint that carries roughly one-fifth of global crude (about 20 million barrels per day under normal conditions). April recorded approximately 191 vessel transits against a pre-conflict norm of ~3,000 per month (Al Jazeera). No other geographic disruption could produce an energy shock of this magnitude this quickly.

United States

Conflicting signals. Q1 GDP was solid, labour markets are healthy, AI-driven capex is real. But April CPI hit 3.8% year-on-year (highest since May 2023), driven by energy: fuel oil +54.3%, gasoline +28.4%, energy services +17.9% (BLS). Core CPI at 2.8% is calmer; PPI at 6% says costs are embedding in production chains. The Fed has stayed silent at 4.75%; markets have moved from pricing three cuts to pricing ~30% probability of a hike by December (CME FedWatch). The bond market is not waiting: 10-year Treasury yields hit 4.63% on 18 May, the highest since February 2025.

European Union

LNG from the US and Qatar replaced Russian pipeline gas after 2022, but Hormuz is re-exposing the gas vulnerability. TTF prices have risen with the broader energy complex. The ECB faces a classic supply-side dilemma: cut further and risk entrenched inflation expectations; hold and compress growth in an economy that lacks the US's AI tailwind. Markets price one final 25bp cut by year-end, down from two-to-three priced in January.

China

The PBoC is still working a domestic demand problem: oversupplied property, soft consumer confidence, elevated youth unemployment. Policy remains accommodative (RRR cuts, MLF rate reductions). For the global picture, the China channel is commodities: weaker construction and steel demand is a partial offset to Middle East energy inflation.

Japan

The BoJ exited YCC in 2024 and is normalising cautiously into a global environment of rising rates. Yen weakness imports energy inflation at exactly the wrong moment. USD/JPY ~158.88 (18 May, Trading Economics) says markets still expect the BoJ to lag.

Emerging Markets

The most exposed region. Energy importers face higher import bills and a stronger dollar. India is the partial exception (IMF projecting above 6% growth for 2026, though also an energy importer). EM bonds have underperformed, spreads wider. Within EM, energy exporters (Saudi, UAE, non-Hormuz Gulf) benefit; importers across South and Southeast Asia bear the cost.

United Kingdom

The most vulnerable G7 economy, with the least room to respond. IMF April WEO downgraded UK 2026 growth to 0.8%, the largest G7 downgrade. The Resolution Foundation identifies the UK as the G7's most gas-dependent economy. 10-year gilts at 5.19% (Trading Economics, 18 May) are the highest since July 2008, squeezing OBR projections and BoE flexibility. Sterling at ~$1.336 is under dual pressure from energy and political risk (Labour leadership speculation pricing into gilts).

Commodities and Crypto

Oil dominates. WTI above $103, Brent ~55% above pre-conflict levels, the World Bank projecting full-year 2026 energy prices +24% (the steepest since 2022). Gold at ~$4,545/oz is outperforming its real-yield model, functioning as geopolitical hedge, inflation hedge, and real-yield hedge simultaneously. Bitcoin at ~$80,120 sits between structural tailwinds (CLARITY Act, Coinbase-Deribit, MiCA July deadline) and the risk-off macro. The medium-term crypto thesis holds; short-term is correlation-driven volatility, not structural deterioration.

01
Micro Deep Dive

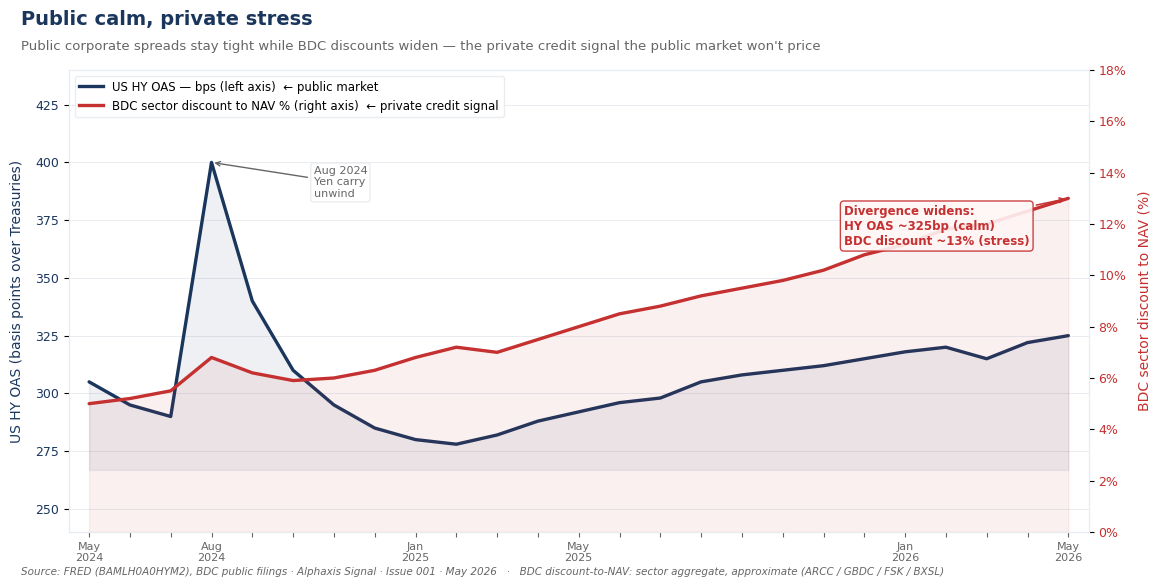
The Hormuz Energy Shock and the Rate Cycle That Won't End
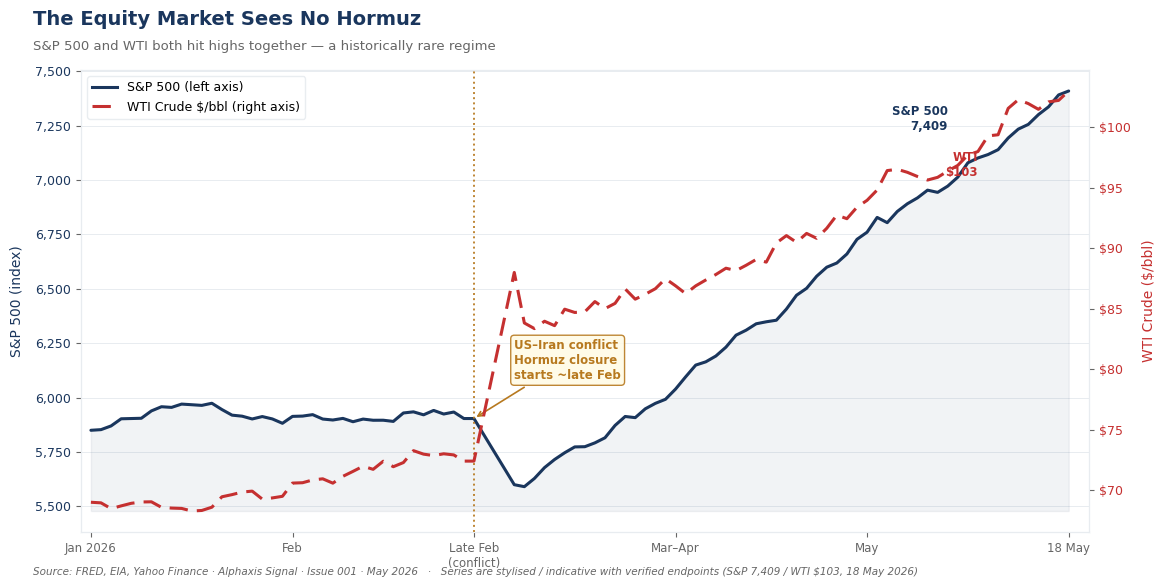
S
Current State
Dual-axis chart: S&P 500 index (left axis, blue) and WTI crude oil price in dollars per barrel (right axis, red dashed), January to 18 May 2026. Both series hit multi-year highs simultaneously following the late-February Hormuz conflict start, marked with a vertical annotation line. S&P 500 reaches 7,409; WTI reaches $103. Historically these two assets have moved inversely during energy shocks.
Figure 1. S&P 500 and WTI crude, YTD 2026: a historically rare simultaneous record. Equities briefly dipped at the conflict start, then resumed their rally as the market concluded the Fed would not hike. Oil didn't agree. In every prior energy shock (1973, 1979, 1990, 2008, 2022) equity and oil diverged sharply. Not this time. Series are stylised / indicative; verified endpoints: S&P 500 7,409 and WTI $103 as at 18 May 2026. Source: FRED, EIA, Yahoo Finance.

The distinction from every prior energy shock is the rate environment into which this one landed. In 1973, 1990, and 2022, oil spiked as equities fell, the classic stagflationary sequence. Here, the S&P 500 sits at record territory while WTI sits at $103. The market is betting the Fed stays patient, the shock is temporary, growth holds. UK 10-year gilts at 5.19% (a level last seen July 2008) and a ~30% Fed hike probability by December suggest the bond market is less sanguine.

F
Forward Projection

Base case: partial ceasefire restores some Hormuz traffic over a 3–6 month horizon, crude retreats, energy CPI begins its lagged descent through Q3, and the Fed holds without hiking. Two false starts have already shown the pattern: relief rallies are sharp but vulnerable if the underlying fiscal position has deteriorated.

T
Trade Setup Lens
Analytical observation only. Not investment advice or a recommendation. See disclaimer at foot of this publication.

Inflation-linked bonds: The 10-year TIPS breakeven (~2.5%) is not obviously mis-priced in the base case, but re-rates materially in the adverse scenario as energy embeds in production chains.

WTI forward curve: Currently in backwardation, the classic supply-shock structure. Watch whether the 12-month forward holds firm even as spot softens on ceasefire news. Persistent backwardation means the market sees the supply story as structural.

Defensive sector rotation: With the 10-year at 4.63% and hike probability non-trivial, multiples compress on growth equities. Cash-generative, low-duration sectors (energy, utilities, healthcare, staples) catch a relative bid. The 15 May sell-off (S&P −1.2%, Nasdaq −1.5%) showed early signs.

Gold: At ~$4,545/oz, gold carries substantial excess over its real-yield model. That excess is geopolitical fear premium. It expands on escalation, unwinds on resolution.

W
Market Reactions to Watch
  • WTI crude: Watch whether spot prices soften materially on any ceasefire news. A sustained retreat from current levels would signal the market is pricing real resolution rather than a temporary pause.
  • US 10-year yield: The direction of the yield relative to current levels (4.63%) is the regime indicator. A sustained move higher would shift market pricing toward the hike scenario; a sustained retreat would signal normalisation is being priced.
  • Gold: Watch for gold either extending above current levels (geopolitical escalation signal) or retreating meaningfully from current levels (normalisation signal).
  • DXY: A strengthening dollar relative to current levels, particularly against EM currencies, would be consistent with the adverse scenario playing out.
R
Risk to Thesis

Primary risk: rapid, durable ceasefire reopens Hormuz within 30 days. Historical precedents (Gulf War 1991, Libya 2011) say these shocks resolve faster than markets price at peak fear. If WTI retraces toward $80 in June, energy CPI falls with the typical 3-month lag and the higher-for-longer repricing unwinds. Second risk: OPEC+ spare capacity (2–3 million bpd from Saudi/UAE per IEA) could take $15–20 off front-month WTI if mobilised.

02
Micro Deep Dive

Shadow-Banking Credit Distress: The Slow-Motion Margin Call

S
Current State
Dual-line chart from May 2024 to May 2026. Blue line (left axis): US High Yield OAS in basis points, flat-to-modest drift from approximately 305bp to 325bp with an August 2024 spike to 400bp that fully normalised. Red line (right axis): BDC sector aggregate discount to NAV percentage, widening steadily from approximately 5% to 13% over the same period. The two series visibly diverge through 2025 and into 2026.
Figure 2. US HY OAS (public credit, left axis) vs BDC sector discount to NAV (private credit proxy, right axis), May 2024 to May 2026. Public market: calm. HY spreads normalised after the Aug 2024 carry-unwind spike; ~325bp is historically moderate. Private market: stress. BDC discounts have nearly tripled from ~5% to ~13% over the same two years. The divergence is the signal. BDCs are the only publicly visible window into private credit quality; quarterly NAV filings make the discount a leading indicator most market participants are not watching. Source: FRED BAMLH0A0HYM2; BDC public filings (ARCC / GBDC / FSK / BXSL sector aggregate, approximate).

The $60 trillion non-bank financial intermediation sector (BIS, 2025) grew almost entirely between 2010 and 2021 with rates near zero. Those assets are now being refinanced at 4.63% 10-year yields, a world their underwriting did not price. Three stress channels: CRE refinancing (~$1.5–2 trillion of US CRE debt rolls 2026–2027 at rates well above origination, per MSCI / NY Fed); BDC mark-downs (the widening discount in Figure 2 is the leading edge of private credit repricing in the one format that must be public); repo and basis trade stress (Treasury basis rebuilt since 2020 and 2023 interventions, but the Fed's capacity to intervene again in a higher-inflation environment is materially more constrained).

F
Forward Projection

Stress remains "slow motion": gradual mark-downs, individual fund gates, widening BDC discounts, no acute event. The boiling-frog dynamic: each mark-down is manageable alone; the aggregate accumulates. Primary indicator: HY OAS drifting wider through Q3 as private repricing bleeds into public.

T
Trade Setup Lens
Analytical observation only. Not investment advice or a recommendation. See disclaimer.

Banks vs private-credit managers: In acute credit stress, regulated banks (capitalised under Basel III) are structurally better positioned than private credit managers. Watch the relative performance of bank equities vs listed alternative asset managers.

IG vs HY credit: Public HY OAS at ~300–350bp is moderate for this rate environment. If private repricing bleeds into public, IG holds relative to HY as quality differentiation accelerates.

Credit quality around marks: Q2 2026 reporting (released Q3) is the first full quarter reflecting the energy shock on borrower credit quality, especially in energy-cost-sensitive sectors (transport, logistics, food, lower-income consumer). BDCs are the most visible read.

Gold in systemic stress: Two competing forces. Initial forced selling (March 2020 pattern), then sharp recovery as the policy response arrives. Gold at $4,545 already carries geopolitical premium; a systemic event sees initial risk-off correlation, then upward decoupling.

W
Market Reactions to Watch
  • HY OAS: A sustained widening well above current indicative levels (~320bp) would signal that credit market stress is broadening beyond the private credit sphere into public markets. The direction and pace of the move matters more than any single level.
  • BDC discount-to-NAV: A meaningful widening of the aggregate sector discount from current levels is a material signal that private credit stress is becoming visible. The Q3 reporting season will be the first definitive read.
  • Treasury basis trade spread: The gap between cash and futures-implied prices. A move beyond recent historical ranges would indicate specific funding stress. NY Fed Liberty Street Economics publishes updated NBFI leverage data regularly.
  • VIX: Elevated VIX readings historically coincide with the threshold at which basis trade margin calls accelerate and repo market function deteriorates.
R
Risk to Thesis

Primary risk: continued extend-and-pretend. Private credit managers have the tools (locked funds, quarterly marks, NAV smoothing) to delay recognition for years. Stress needs a catalyst, and catalysts get delayed if solvency never becomes acute. Second risk: a rate cut cycle starting Q4 2026 or early 2027 reduces refinancing costs and resolves the duration mismatch at the core. The energy dynamic has lowered the probability but it remains the market's base case.

03
Micro Deep Dive

AI Capex Cycle and the Semiconductor Concentration Risk

S
Current State

Scale, in one frame: combined hyperscaler capex from ~$140bn in 2022 to a guided ~$340bn in 2026E, +143% in five years. Nvidia shipped an estimated $40bn+ in GPU revenue last fiscal year, with the forward order book "fully subscribed" through at least 2026. Asian semiconductor exports rose 68% in 2024 (WTO).

The equity consequence is extreme concentration. The Mag-7 sits at ~30–35% of SPX. When five of those seven spend at record levels and the primary hardware beneficiary is also in the index at extreme weighting, the result is a self-referential feedback loop with no clean precedent.

Two binding constraints most commentators under-price. TSMC foundry capacity: no alternative exists for leading-edge node production. Power and grid: AI data centres are the most significant new driver of developed-market electricity demand (IEA 2025 Electricity Report), and the US grid was not built for this load. A 10–15 year capital cycle, already underway, independent of any quarterly print.

F
Forward Projection

The real framing for the 3–12 month horizon is not "real vs bubble" but "monetisation pace vs investment pace." If hyperscaler quarterly guidance keeps accelerating, concentration sustains. If two or three simultaneously revise down in the same cycle, the demand signal inverts sharply. Q2 2026 earnings (July) is the next read.

The Cisco 1999–2000 analogy needs correction. Cisco was infrastructure to a real buildout priced for a demand ramp that never arrived at speed. The hyperscalers have recurring subscription revenues at extraordinary scale, backing AI demand with actual revenue. They are capacity-constrained on existing demand, not speculating on future demand.

T
Trade Setup Lens
Analytical observation only. Not investment advice or a recommendation. See disclaimer.

Semi equipment vs design: Equipment suppliers to foundries hold up in a capex pause better than design names, because TSMC and Samsung invest in capacity regardless of which chip design wins. Watch the relative performance as a signal that fab investment is slowing even as end-demand stays elevated.

Power and grid infrastructure: Companies exposed via grid, transformers, and power management have multi-year backlogs and trade on capex multiples, not growth multiples. A way to be long the AI infrastructure theme without the hyperscaler-and-GPU concentration risk.

Concentration around earnings: Q2 2026 earnings concentrate risk in a narrow July window. With 30–35% index weighting in a handful of names, a material miss has non-linear consequences. The IV-vs-RV spread in the weeks before major reports measures how much premium the market pays for that uncertainty.

W
Market Reactions to Watch
  • Semiconductor index trend: A sustained breakdown of the broad semiconductor index below its long-term moving average would be the first technical signal of a cycle pause, more meaningful as a signal than any single name's move.
  • Mag-7 weighting in SPX: A meaningful decline in the combined index weighting from current levels (indicative 30–35%) would signal that rotation away from concentration has begun in earnest.
  • Hyperscaler quarterly capex guidance: The single most important number in the AI cycle. Any sequential deceleration in aggregate hyperscaler AI infrastructure spending guidance is the trigger for the risk scenario; the direction matters more than any specific figure.
  • Major tech earnings volatility premium: The relationship between implied and realised volatility in the weeks before major technology earnings windows is a measure of how much premium the market is paying for the uncertainty concentrated in a narrow reporting season.
R
Risk to Thesis

Primary upside risk: capex accelerates rather than pauses, monetisation ramps exceed projections, Cisco parallel dissolves entirely. Primary downside risk specific to 2026: geopolitical risk to the Taiwan supply chain. Any escalation in cross-Strait tensions dwarfs any earnings miss. TSMC's 7nm and below capacity is irreplaceable on any 2–3 year horizon.

04
Micro Deep Dive

Emerging Markets — Crypto, Blockchain & Tokenised TradFi

S
Current State
Two-panel chart. Left panel: BTC dominance percentage of total crypto market cap from January 2024 to May 2026, showing a climb from approximately 45% to 57.5%, annotated with the BTC halving in April 2024, US election rally in November 2024, and MiCA clarity signal in July 2025. Right panel: stacked bar chart comparing stablecoin supply percentage by jurisdiction in May 2025 versus May 2026. Offshore issuers (Tether etc) fall from 75% to 63%; EU MiCA-compliant issuers rise from 3% to 9%; US-regulated issuers (USDC, PYUSD) rise from 22% to 28%.
Figure 3. BTC dominance (% of total crypto market cap), Jan 2024 to May 2026 (left) and stablecoin supply by jurisdiction, May 2025 vs May 2026 (right). BTC dominance at ~57.5% is a multi-year high, with capital rotating from altcoins into the asset with the clearest regulatory treatment globally. Stablecoin supply is migrating: EU MiCA-compliant share has tripled from 3% to 9% ahead of the 1 July 2026 deadline; offshore (Tether) share compressing. The structural shift in stablecoin jurisdiction is an early signal of how regulatory clarity reprices market share, and which asset classes benefit when rules become predictable. Source: CoinGecko, DefiLlama, public stablecoin issuer reports (approximate, based on publicly disclosed supply figures).

May 2026 may be remembered as the month crypto stopped arguing for legitimacy and started receiving it. A quieter but potentially larger structural shift is accelerating beneath the surface: tokenisation of traditional financial assets at institutional scale. The two stories are converging into the most substantive structural change since the January 2024 ETF approvals.

Figure 3 captures both forces. BTC dominance toward 57.5% (highest since early 2021) reflects flight to the asset with clearest global regulatory treatment: CLARITY Act advancing, ETF approval behind it, mature custody. The altcoin universe faces maximum regulatory ambiguity heading into MiCA's 1 July deadline, with hundreds of tokens still being classified (utility vs asset-referenced vs e-money) by EU national competent authorities.

The stablecoin panel is the more precise signal. EU MiCA-compliant supply has tripled since May 2025: Circle's EURC, Societe Generale's EURCV, and several smaller issuers have moved fast. Tether's offshore share is compressing not because total supply is falling (it grows in absolute terms) but because compliant alternatives grow faster. The race for institutional settlement-rail access is decided by 1 July.

F
Forward Projection

Post-MiCA liquidity fragmentation in EU crypto markets resolves faster than feared as authorised exchanges absorb flow. BTC dominance stays elevated as macro risk-off suppresses altcoin appetite. CLARITY Act passage (indicative Q3–Q4 2026) is the next material positive catalyst for the asset class.

R
The Rise of Blockchain TradFi

The more structurally significant development may not be crypto-native at all. Real-world asset (RWA) tokenisation, placing traditional assets on blockchain rails, has accelerated sharply since 2024. Tokenised US Treasuries lead: a major US asset manager's tokenised money market fund (launched March 2024) surpassed $500m AUM by mid-2024, with further growth projected. Comparable products from competing managers have validated the model across issuer types.

The asset class is broadening. Tokenised commodities (gold, silver, oil derivatives) offer on-chain access to historically offline markets, with the leading gold-backed token alone at hundreds of millions in AUM. Tokenised private credit platforms exceed $1bn aggregate institutional AUM. Tokenised equity share classes are emerging in Europe. Total tokenised RWA: ~$5bn in 2023 to an estimated $15–25bn by mid-2026 (RWA.xyz, approximate).

Bar chart showing growth in tokenised real-world assets on blockchain from 2020 to projected 2026. Total market grows from under $2bn in 2020 to approximately $20bn by mid-2026. Stacked bars show composition by asset type: US Treasuries (dominant, dark blue) accelerate sharply from early 2024 following BlackRock BUIDL launch in March 2024; private credit (teal) grows steadily; commodities and equities remain smaller categories throughout the period.
The Rise of Blockchain TradFi. Tokenised real-world assets (Treasuries, private credit, commodities, equities) have grown from approximately $5bn in 2023 to a projected ~$20bn by mid-2026. BlackRock's BUIDL launch in March 2024 marks the inflection point where institutional Treasuries began dominating the on-chain RWA mix.

For Alphaxis, the convergence of crypto market structure with TradFi is the firm's emerging-alpha thesis. If RWA tokenisation crosses $25bn and institutional rails route sovereign debt and credit on-chain, structural arbitrage emerges between on-chain and off-chain pricing for the same underlying. AMM efficiency applied to tokenised yield-bearing assets extends our AMM Scanner thesis. Basis trades between on-chain and off-chain venues for the same instrument are a genuinely novel arb venue that did not exist at scale 24 months ago. A 12–24 month structural watch; near-term setup is thin, direction of travel is clear.

W
Market Reactions to Watch
  • BTC dominance: A sustained move materially above current levels would signal further altcoin capitulation and maximum flight-to-BTC positioning, historically a contrarian indicator for the broader crypto cycle.
  • CLARITY Act Senate progress: Any committee vote or floor scheduling is a material catalyst for US institutional crypto flows and a positive structural signal for the asset class.
  • MiCA-compliant stablecoin share: Continued growth in EU-compliant stablecoin supply as a percentage of the overall market would signal that regulatory architecture is reshaping capital flows at a structural level.
  • Crypto options market structure: The completed Coinbase-Deribit acquisition creates the first major US-regulated crypto options venue; watch for any observable shift in institutional options market flows that may follow the integration of the two platforms.
  • RWA.xyz total tokenised AUM: Monthly tracking of the public RWA aggregator figure is the simplest proxy for the pace of TradFi tokenisation. A sustained acceleration above current growth rates would signal institutional settlement rails are beginning to route material flow through on-chain venues.
R
Risk to Thesis

Primary risk: macro correlation override. In a genuine risk-off event (HY OAS sharply wider, equities selling off), crypto sells off alongside all risk assets regardless of structural positives, as March 2020 showed. The regulatory thesis is constructive over 12–18 months; it does not insulate against a 6-week drawdown if private credit stress crystallises. Secondary risk: BTC dominance declines despite constructive regulation. If CLARITY passes and altcoins rally, the dominance read reverses fast. That would be positive for the broader asset class even if it reads confusingly on this single metric.

Sector Watch: May 2026

Sector-level, scenario-conditional observations only. The commentary below identifies sectors and themes that may benefit or face pressure depending on how the macro scenarios described in the deep dives above develop over the coming 2–3 months. This is not investment advice, a personal recommendation, a financial promotion, or a suggestion to trade any specific instrument. See full disclaimer at the foot of this publication. Timeframes are indicative only.
# Sector / Theme Directional Bias Scenario That Plays Out Timeframe DD
1 Energy producers May benefit If Hormuz disruption persists into Q3 without a durable resolution 2–3 months DD1 →
2 Inflation-linked bond markets May outperform nominal duration If energy costs continue embedding in production chains and inflation expectations drift higher Coming quarter DD1 →
3 Defensive equity sectors (healthcare, consumer staples, regulated utilities) May benefit on a relative basis If rising yields compress growth-equity multiples and investors rotate toward cash-generative, low-duration names 2–3 months DD1 →
4 Precious metals May maintain elevated pricing or extend If geopolitical uncertainty deepens or questions arise about monetary policy credibility Coming quarter DD1 →
5 Investment-grade credit vs high-yield IG may hold relative to HY If private credit stress bleeds into public credit markets and quality differentiation accelerates Coming quarter DD2 →
6 BDC sector Elevated scrutiny If Q2 marks reveal energy-shock impact on mid-market borrower quality and sector discount-to-NAV widens materially 2–3 months DD2 →
7 Regulated banks vs private credit managers Banks may outperform on a relative basis If credit stress in non-bank intermediation accelerates and investors price the capital adequacy gap between regulated and unregulated balance sheets 2–3 months DD2 →
8 Digital asset infrastructure and exchange sector May benefit structurally If the CLARITY Act establishes a durable US regulatory framework for crypto and institutional allocators begin formalising their frameworks 2–3 months DD4 →
9 EU-authorised crypto venues May gain competitive advantage If MiCA enforcement from July 2026 reallocates flows toward licensed operators at the expense of non-compliant platforms Coming quarter DD4 →
10 Power and grid infrastructure sector May benefit structurally over the medium term If AI data-centre buildout continues driving record electricity demand regardless of near-term AI sentiment 2–3 months onwards DD3 →
11 Semiconductor equipment sector May hold relative to design names If the AI capex cycle shows early signs of pacing back; equipment suppliers are less sensitive to which chip design wins 2–3 months DD3 →
12 EM energy-importing economies May face pressure If energy prices remain elevated and the US dollar stays firm, compressing both import budgets and USD-denominated debt servicing capacity Coming quarter DD1 →

Calendar Ahead: June 2026

Dates marked TBC require verification against official central bank calendars before publication.

Date Event Region What to Watch
3 Jun 2026 FCA CP26/13 consultation close UK / Crypto Final date for UK crypto perimeter guidance submissions. Outcome shapes the UK regulatory framework ahead of October 2027 go-live
5 Jun (TBC) OPEC+ monitoring committee Global / Oil Supply response to Hormuz disruption; any Saudi/UAE supply increase would move WTI significantly
11 Jun 2026 FOMC rate decision US / Global No hike expected but language shift possible; "higher for longer" vs explicit hike signal would move bonds significantly
12 Jun 2026 ECB Governing Council meeting EU / EUR Rate decision + forward guidance; one final 25bp cut still in market consensus (verify against current ECB pricing)
12–13 Jun Bank of Japan policy meeting Japan / JPY Normalisation pace signal; USD/JPY sensitivity to any BoJ rate move in current global context
Mid-Jun (TBC) Nvidia FQ1 FY2027 earnings US / Global Tech Most important single earnings event for AI capex read and global tech sentiment; 30–35% SPX concentration risk
Mid-Jun (TBC) G7 Summit 2026 Global Geopolitical coordination on energy security + Iran conflict; any joint statement on Hormuz matters for oil
Late Jun 2026 US PCE inflation (May data) US / Fed target The Fed's actual target metric; a print above 2.5% is the clearest trigger for the rate-hike scenario
30 Jun 2026 Q2 2026 close Global / Credit Quarterly mark-to-market for private credit / BDC portfolios; sets up the reporting season stress reads in July/August
1 Jul 2026 EU MiCA transitional period ends EU / Crypto Critical deadline for crypto exchanges operating in the EU; firms without authorisation must exit or have applications in progress; liquidity profile changes expected
Late Jun (TBC) BoE MPC meeting UK / GBP Rate decision; energy shock has materially reduced probability of further cuts; gilt market reaction to any forward guidance shift
Final Note

On 12 May 2026, the owner of a Welsh Mountain pony named Chewbacca took him to Tesco for reasons the local press did not fully explain. Security staff (presumably not briefed on this eventuality in their training programme) politely asked the owner to leave. The horse was unbothered.

There is a long-running academic debate about whether markets are rational. The Hormuz oil shock, the private credit mark-to-market problem, and the AI capex cycle are all, at their core, questions about how humans price things they cannot fully see: future supply, hidden leverage, and the rate at which a new technology monetises. Chewbacca, to his credit, was simply trying to get biscuits. He knew what he wanted. He had a plan.

We should all be so focused.

Sources cited in this issue